Buyer: Audience Planning Tool: Calculations Explained
The audience planning tool allows you to compare inventory based on your target audience. This article highlights how values are calculated.
Key Terminology
Index - a single number used to compare the magnitude of differences within a single audience segment (e.g. 1.53 for billboard A is better than 1.02 for billboard B.)
Composite Score - an overall score for inventory based on one or more audience datasets (e.g. index, custom audience data) for the plan.
Quintile - any of five equal groups into which the composite score can be divided according to the distribution of values for the composite score.
How we calculate an index:
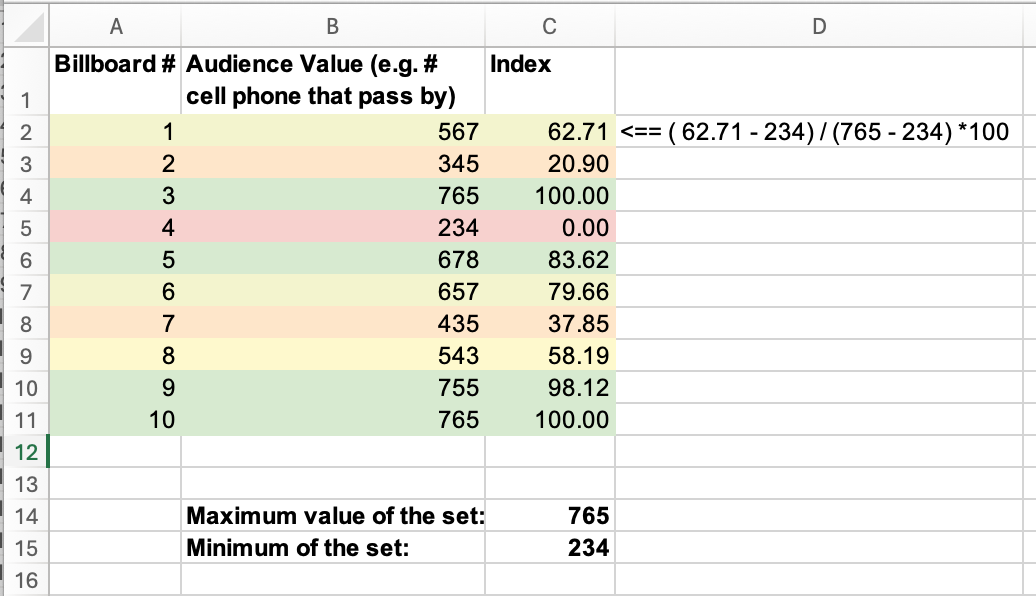
- Maximum of the data set = 100%
- Minimum of the data set = 0%
- Every billboard index score = (raw value - min) / (max-min) *100
- For a single audience, the index is equal to the composite score.
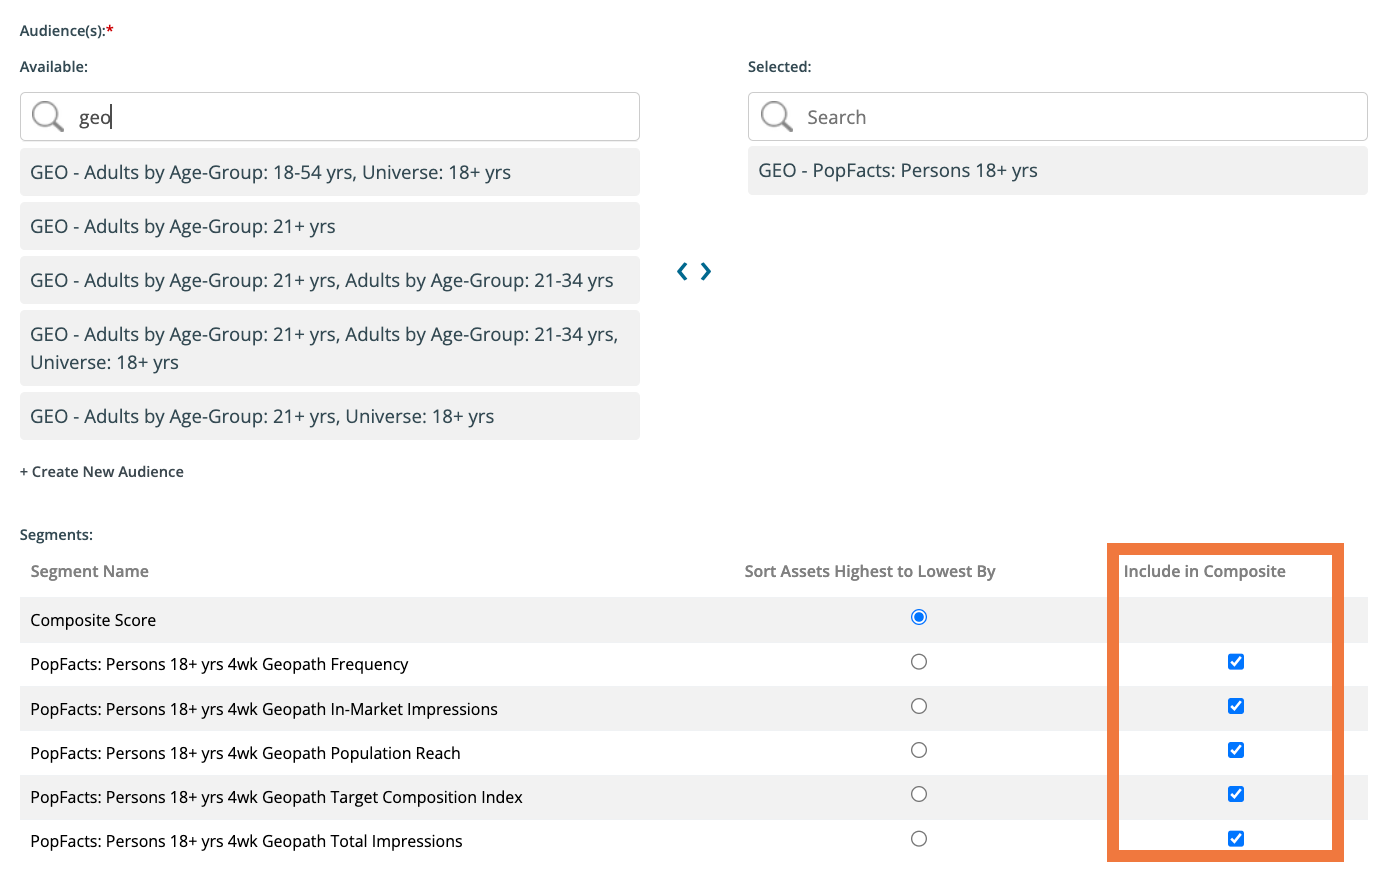
How we calculate the Composite Score
- We calculate the index for each audience in the plan.
- We normalize the data to keep scores from 0 to 100. An empty composite score indicates underlying data is missing.
- Each audience data set is weighted equally.
Quintiles
Inventory is broken into five groups based on the composite score.
- Green: 81%-100% is the top quintile which represents the best inventory for the audience(s)
- Light Green: 61% - 80% is the 2nd best quintile
- Yellow: 41% - 60% - is the 3rd quintile
- Orange: 21% - 40% is the 4th quintile
- Red: 0% - 20% is the bottom quintile
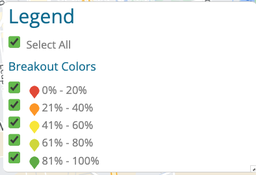
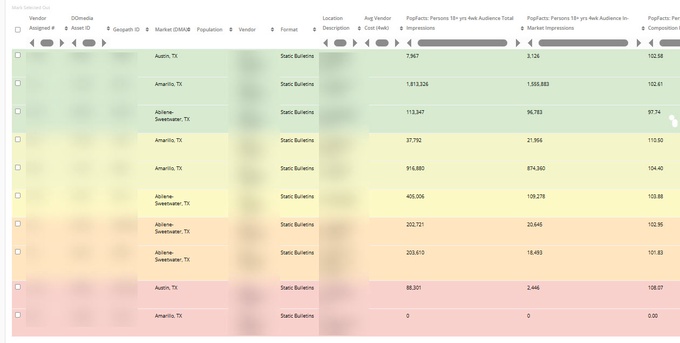
The green-to-red quintile shading corresponds to the row color in the results and the pin color on the map
Geopath Example:
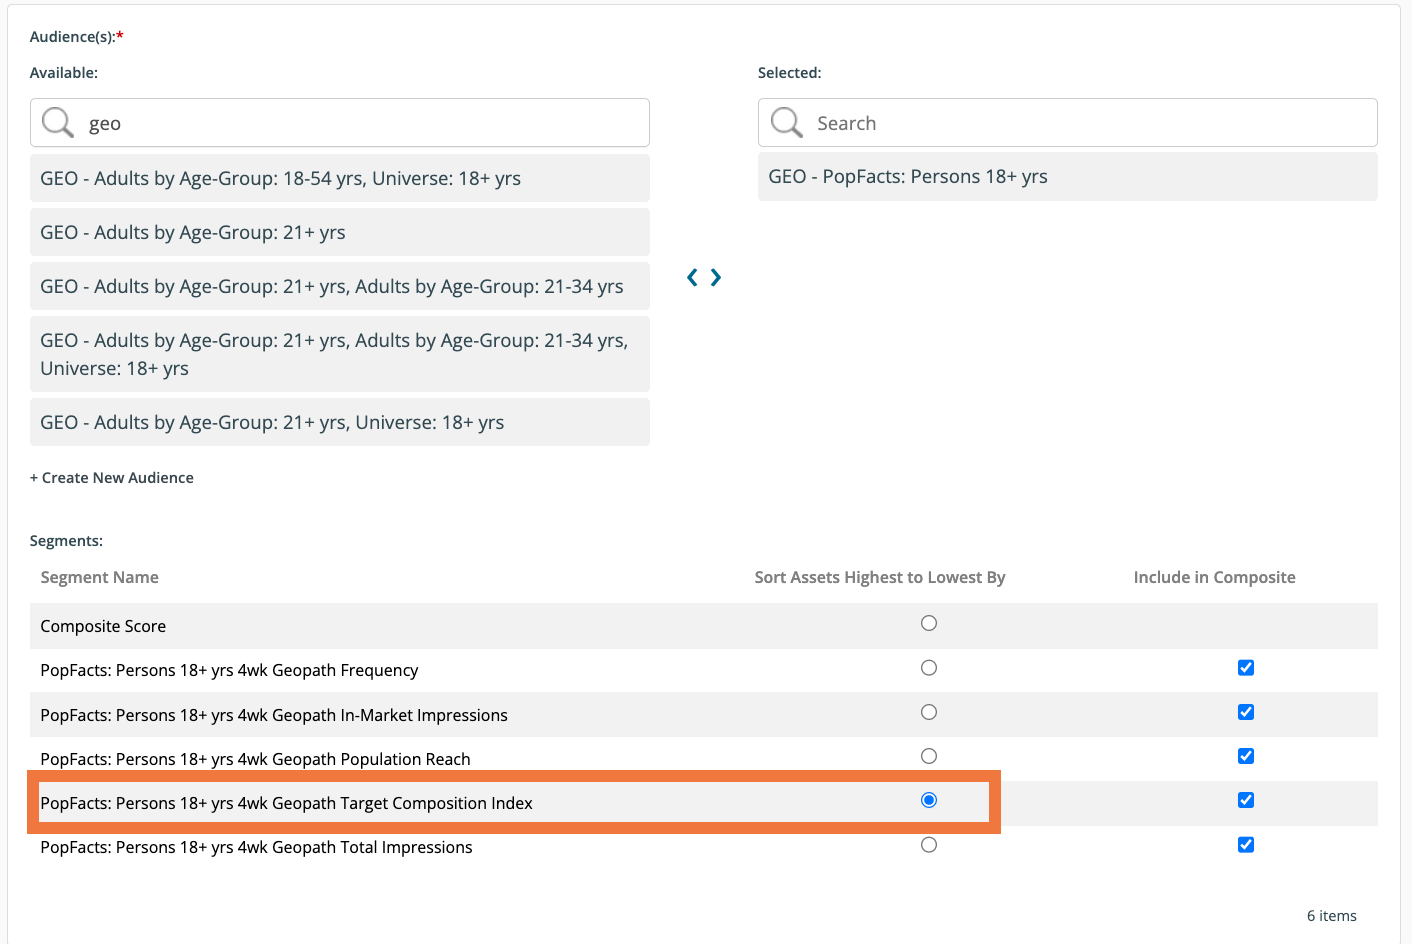
The Geopath Target Composition Index will differ from the Audience Plan Composite Score.
The Geopath Target Composition Index is directly from Geopath.
The Audience Plan Composite Score factors all selected values that are included in the Composite Score. In this case, Frequency, In-Market Impressions, Reach, Target Composition Index and Total impressions are factored in (not just Target Composition Index).