Forecasting
Forecasts have been designed to be a powerful tool within our platform to help you gain valuable insights from your annual spending data. With this functionality, you can create an initial forecast, track against that plan, and make adjustments when necessary.
Before Forecasts can be created, you will need to set up Measurement Preferred Partners. Please refer to This Support Article to learn how to set this up.
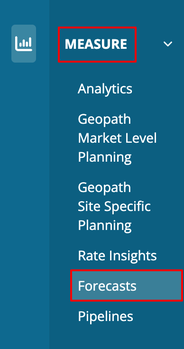
Accessing Forecasting:
You can access this tool by clicking "Measure" then "Forecasts" On the left-hand side menu.
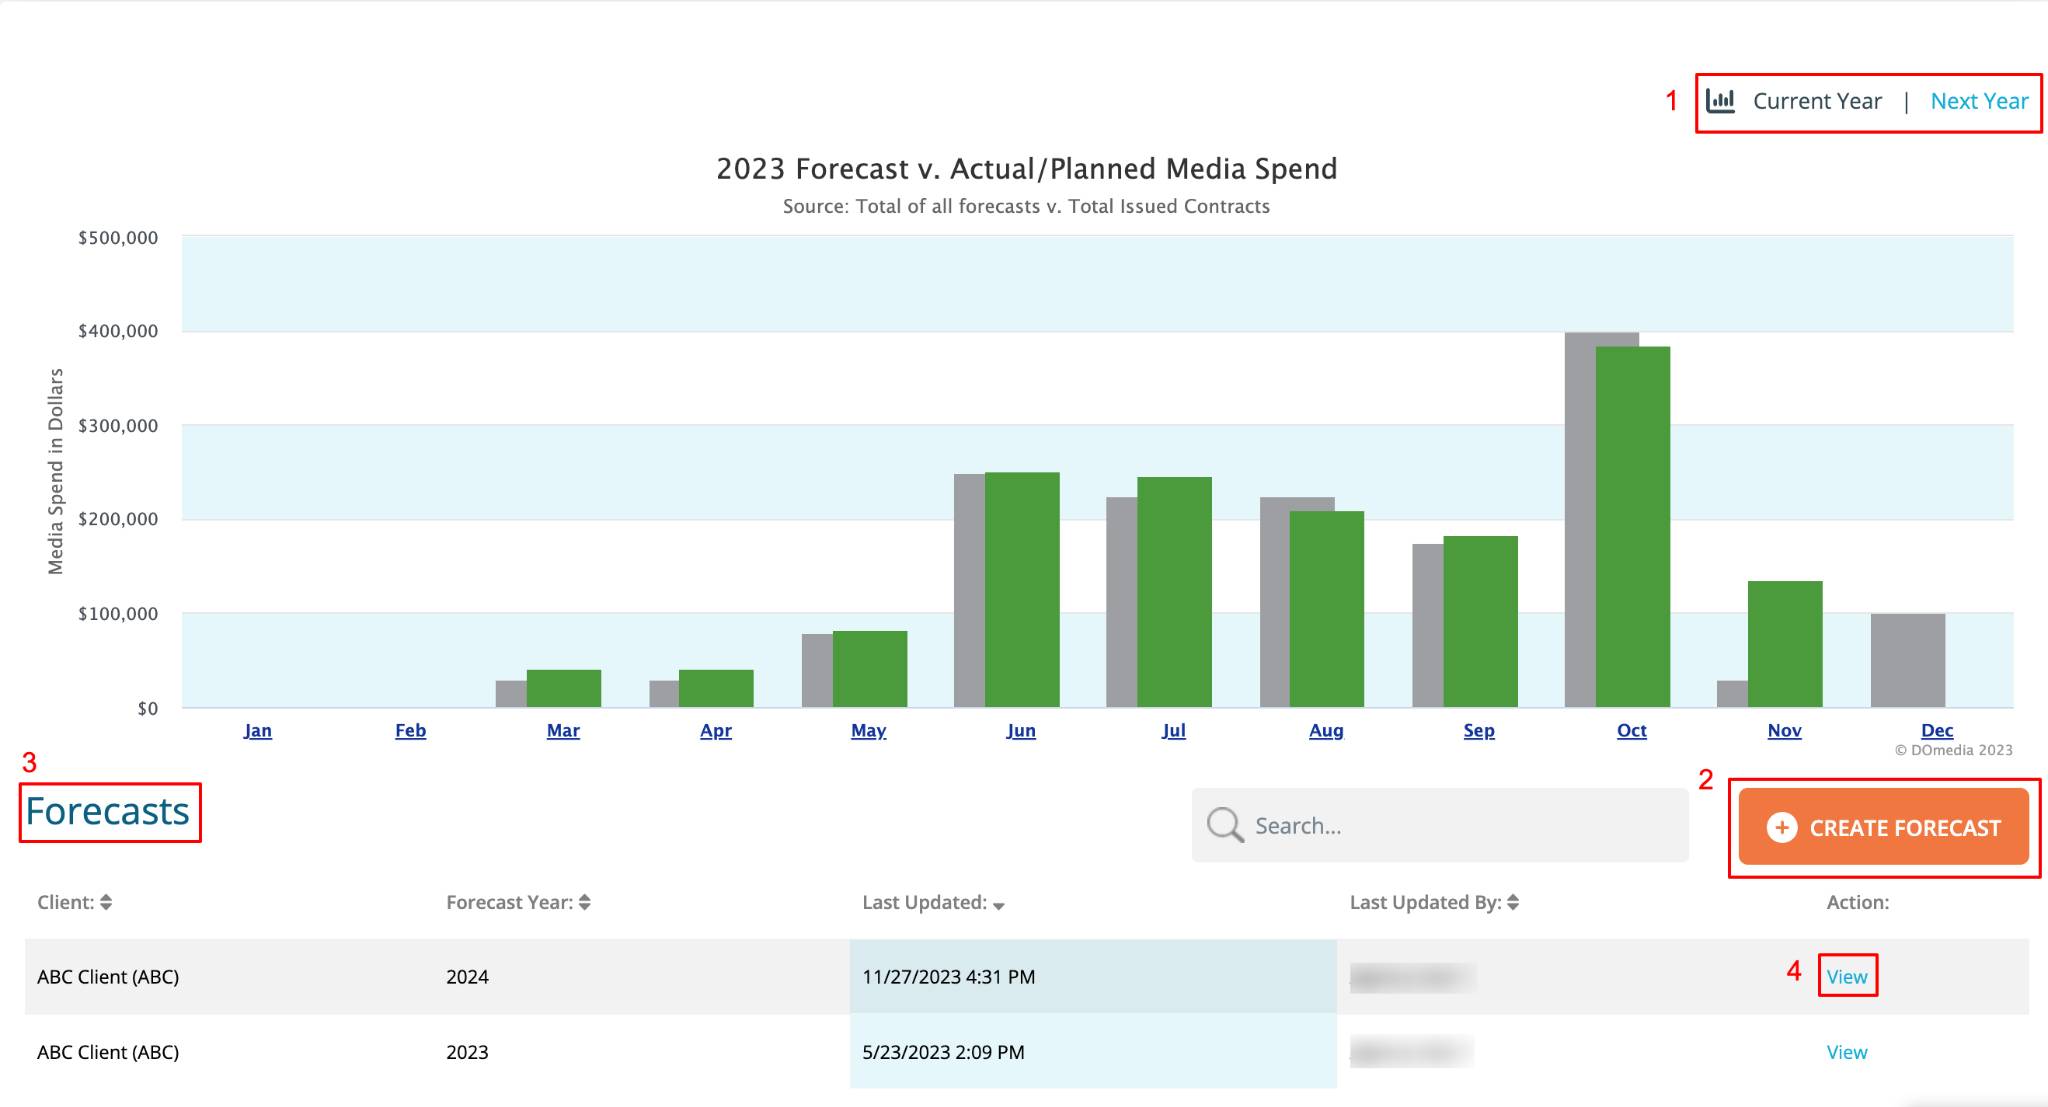
Forecast Dashboard:
Your dashboard displays the Forecast vs. Actual/Planned media spend graph. Dashboard functionalities include:
- You can select "Current year" or "Next Year" at the top of the graph to view.
- Create new forecasts by clicking "Create Forecast."
- View all previously created forecasts listed on the dashboard.
- View specific forecasts by clicking "View" next to the one you wish to see.
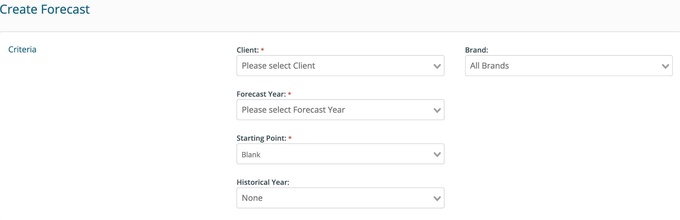
Creating your Forecast:
To begin, fill in the following details:
- Client
- Forecast Year
- Starting Point
- Historical Year (Optional - If you pick a historical year, that year's data will be put in the grid as a starting point.)
- Brand (Optional)
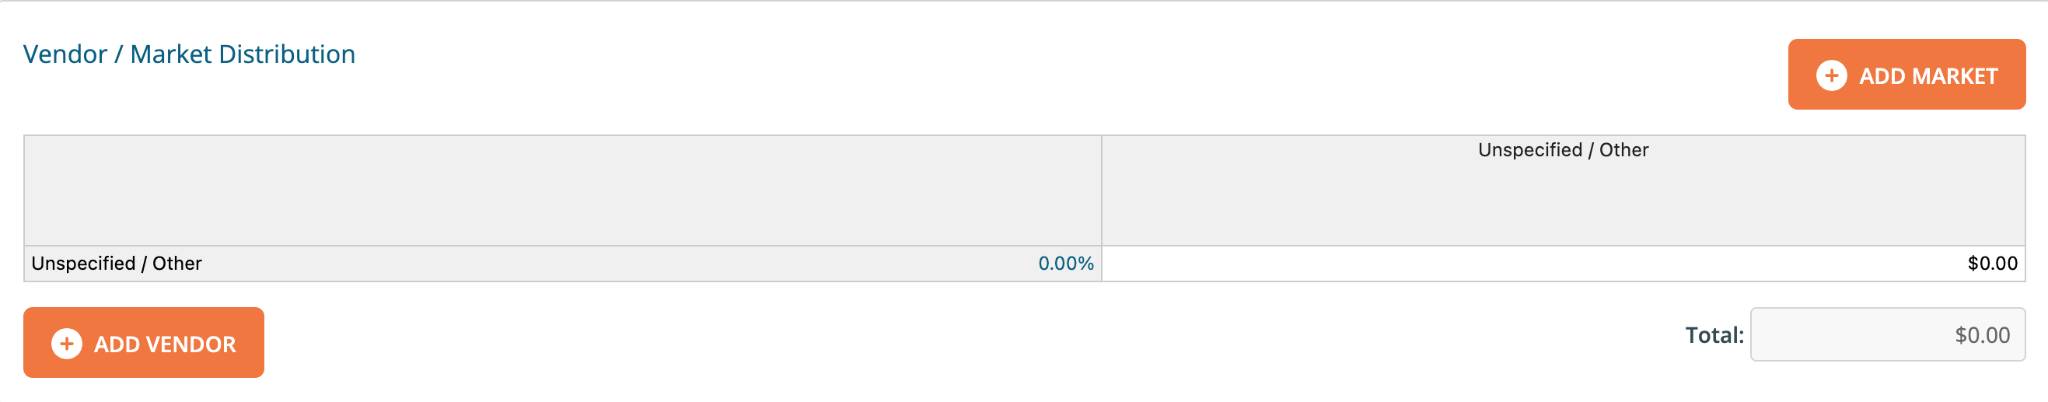
Add Vendors and Markets to a Forecast by clicking the buttons
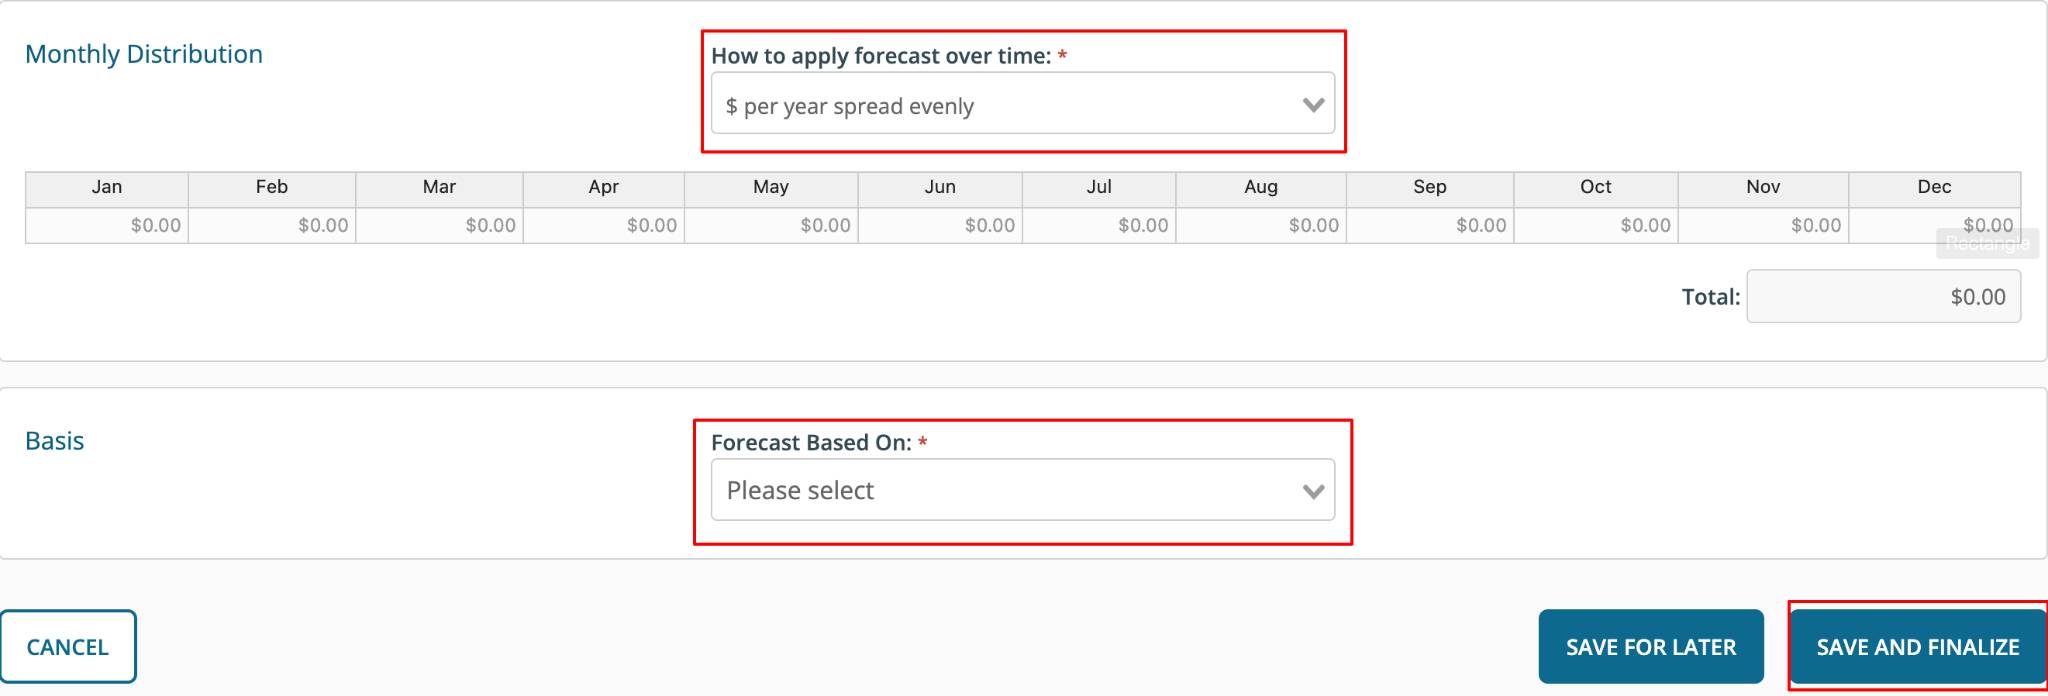
Select your preference for 'How to apply forecast over time' using the dropdown menu. You can document the basis for the forecast by making a selection from 'Forecast Based On.' Once you have made your selections, click 'Save and Finalize'.
Once your forecast is finalized, you will see a success message at the top.

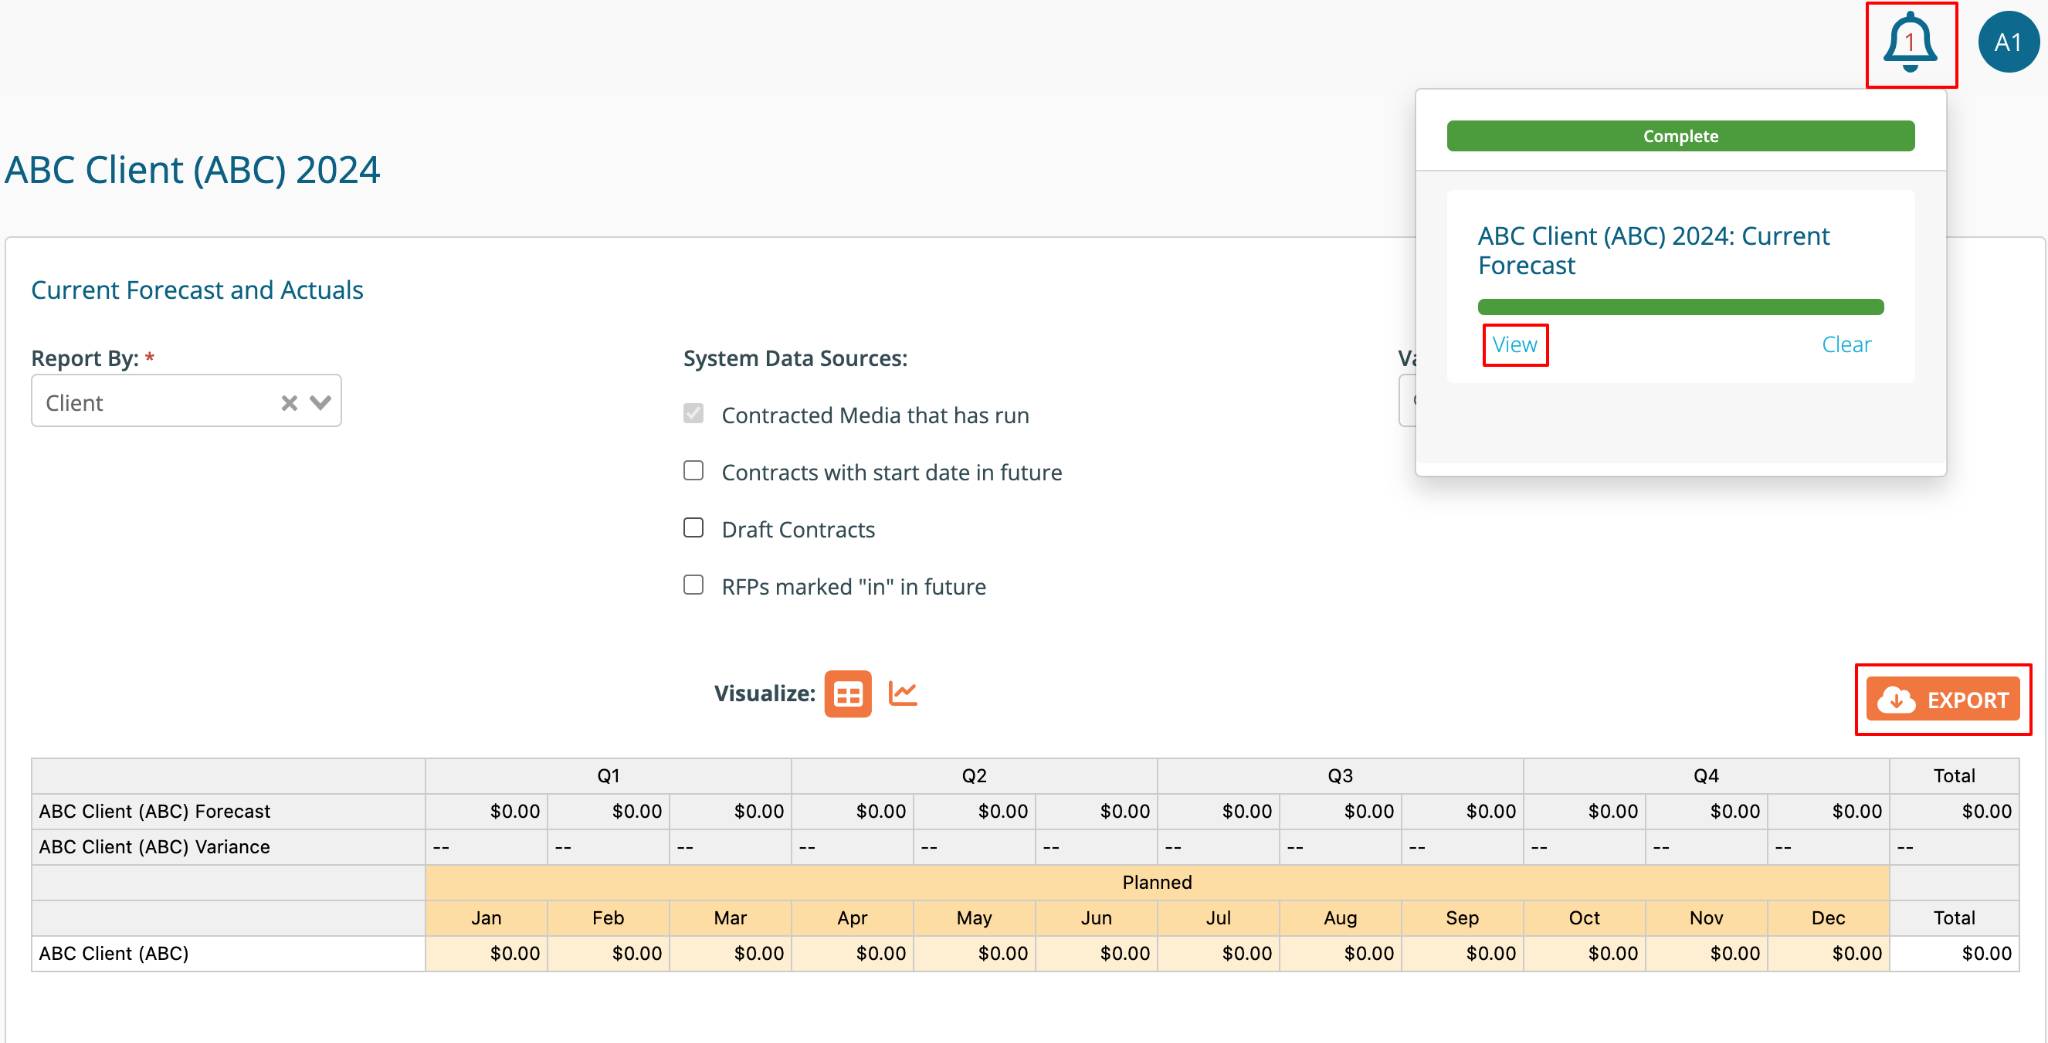
Viewing Forecast:
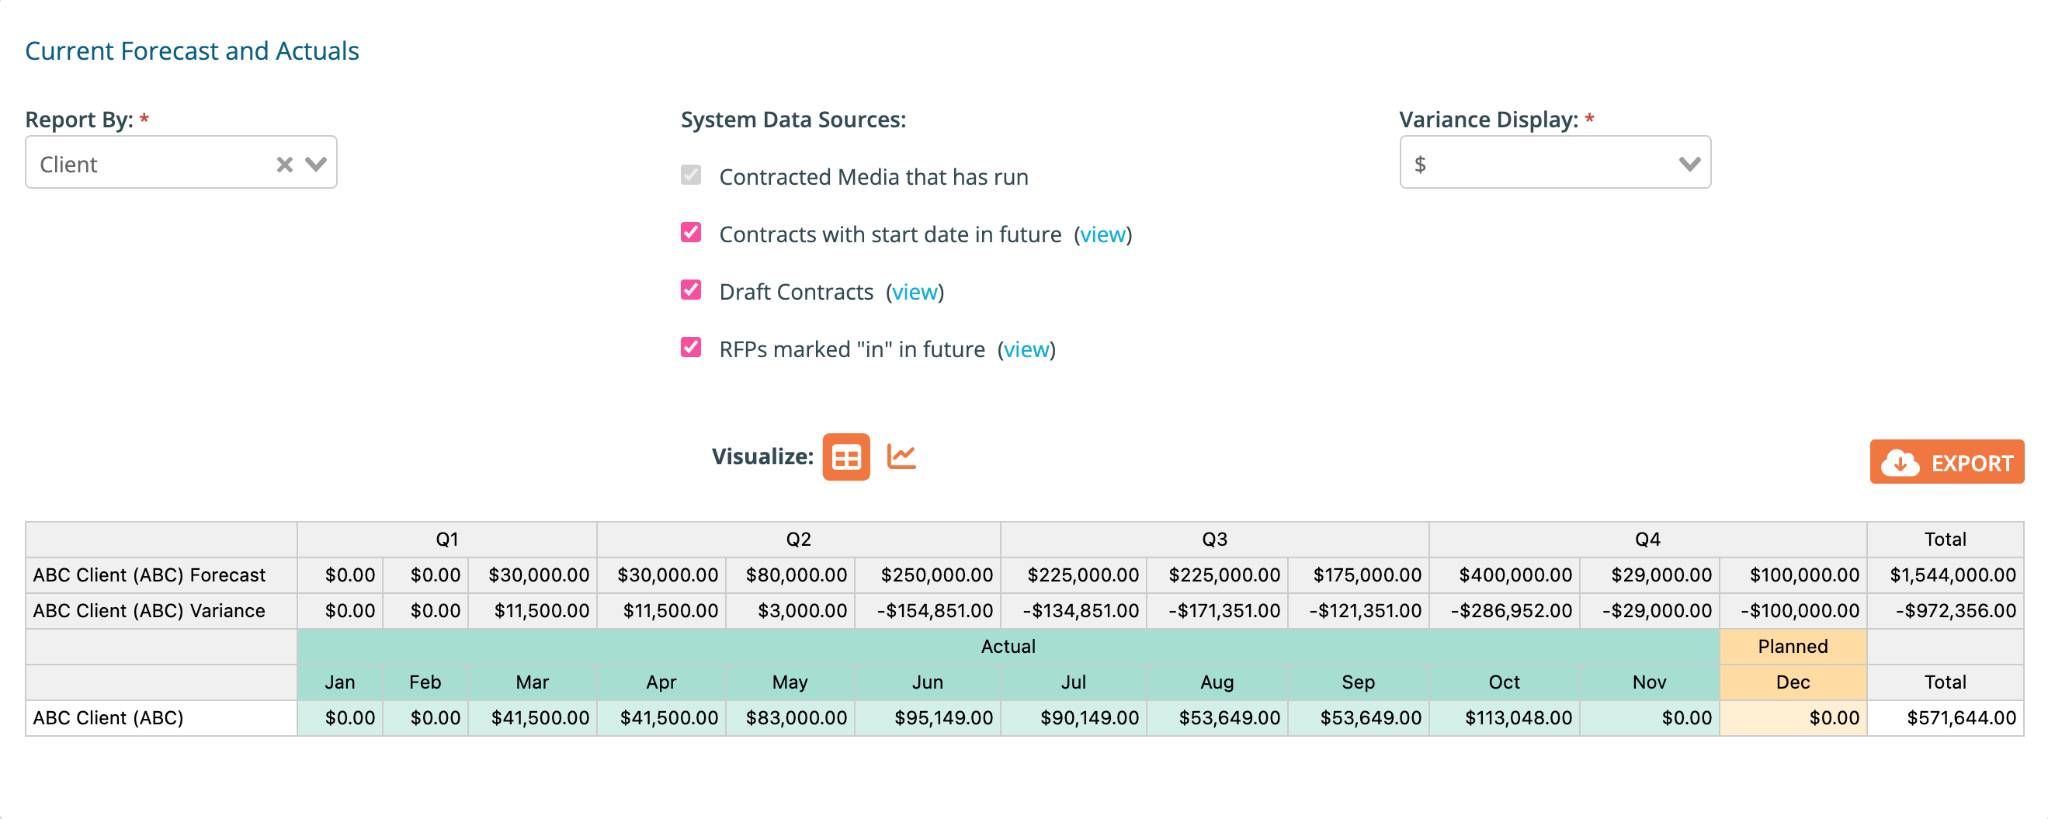
Choose the reporting criteria under "Report by" (Required).
Select your System Data Sources.
Set your preference for "Variance display" (Required).
Then, go to the "Visualize" tab to choose how your data is displayed.

Interpreting Graph Colors:
In our graphs, colors are used to distinguish between different types of data:
Green: Represents actual data. This is real, historical data that is unchangeable, reflecting past performance or results.
Yellow: Indicates forecasted data. This represents projections or estimations.
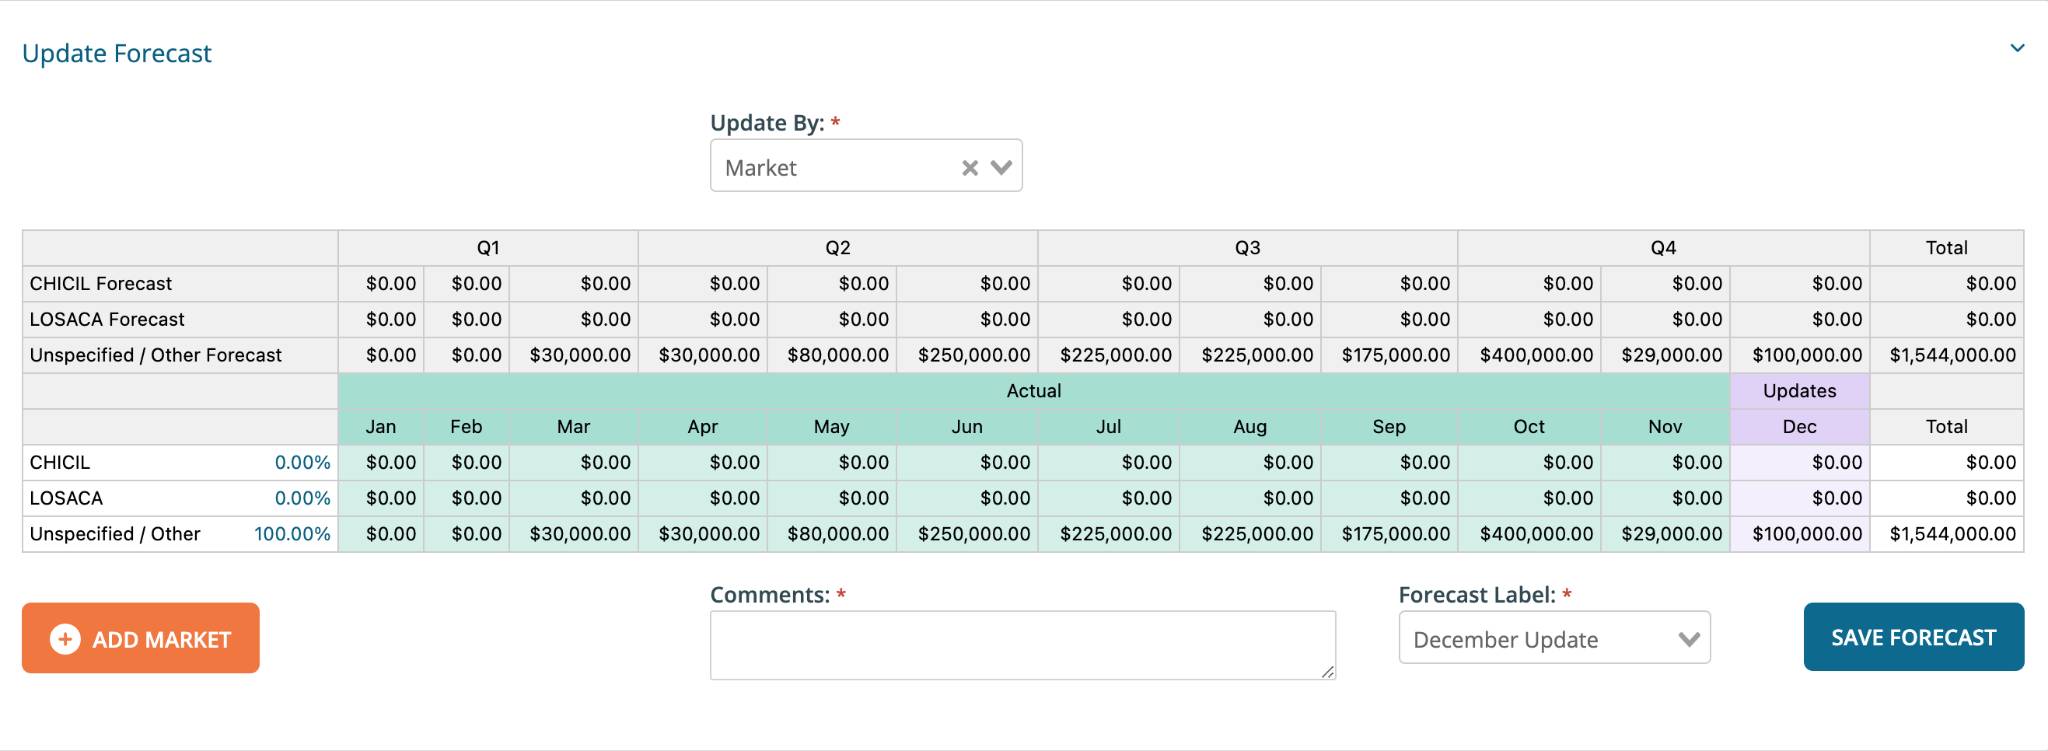
Purple: Editable forecasting data when making changes. (only applicable to "Update Forecast")
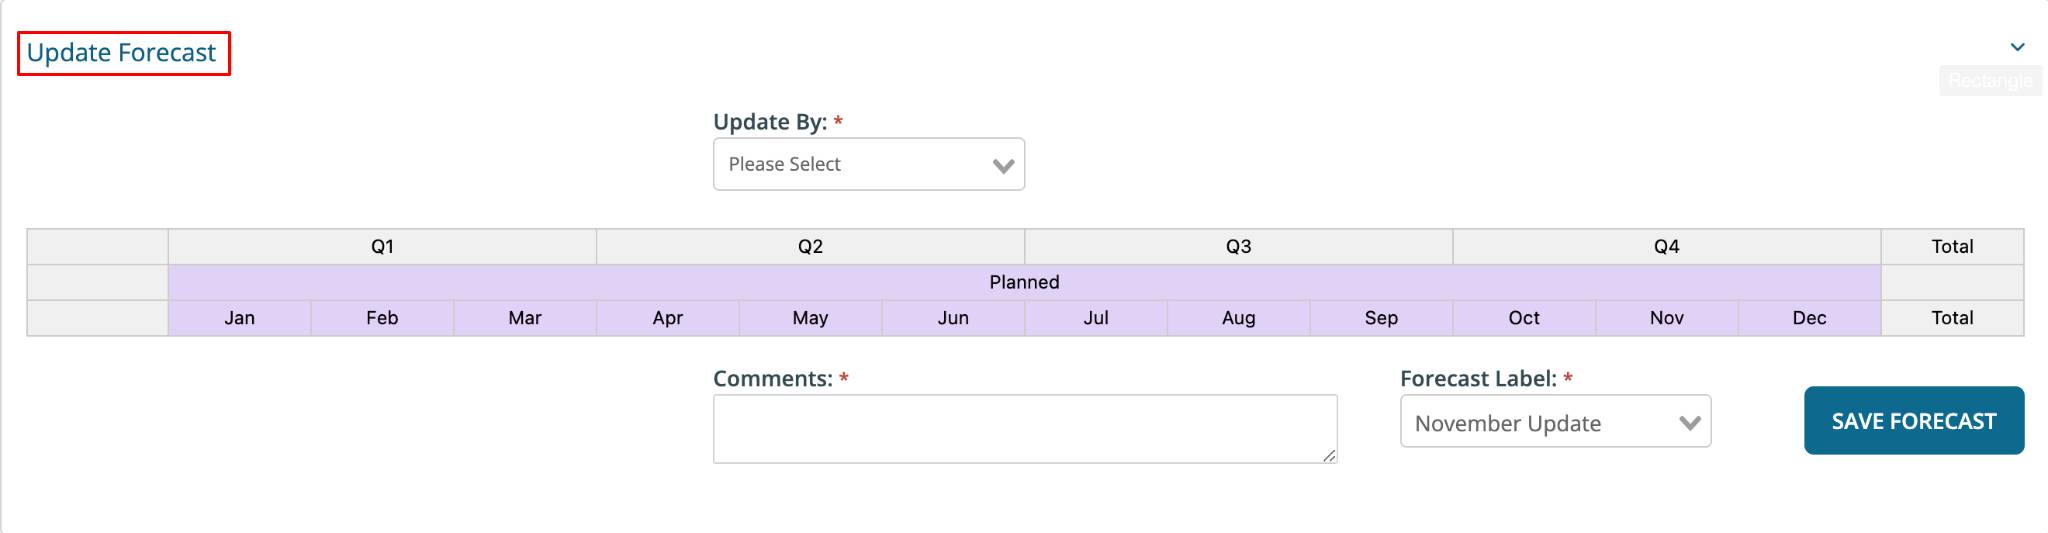
Updating Forecast:
Use the dropdown to change "Update By" and decide whether to maintain your forecast by vendor or market. You can change purple shaded values to update your forecast numbers.
Use the dropdown to select a new "Forecast Label."
Enter any comments in the "Comments" box.
Click "Save Forecast" to apply the updates.
Exporting Your Forecast:
To download your forecast data, click "Export" to initiate the download of your forecast data in an Excel spreadsheet format. Once the download is complete, click "View" to open and review your spreadsheet.